
Data-Driven
Decision Making
We help organizations unlock the full potential of their data. From building robust data warehouses to creating stunning interactive dashboards, our BI team delivers solutions that turn complex datasets into clear, actionable strategies.
Get Started
Building a Modern Supply Chain Data Warehouse: How Power BI Turns Raw Data into Real Decisions
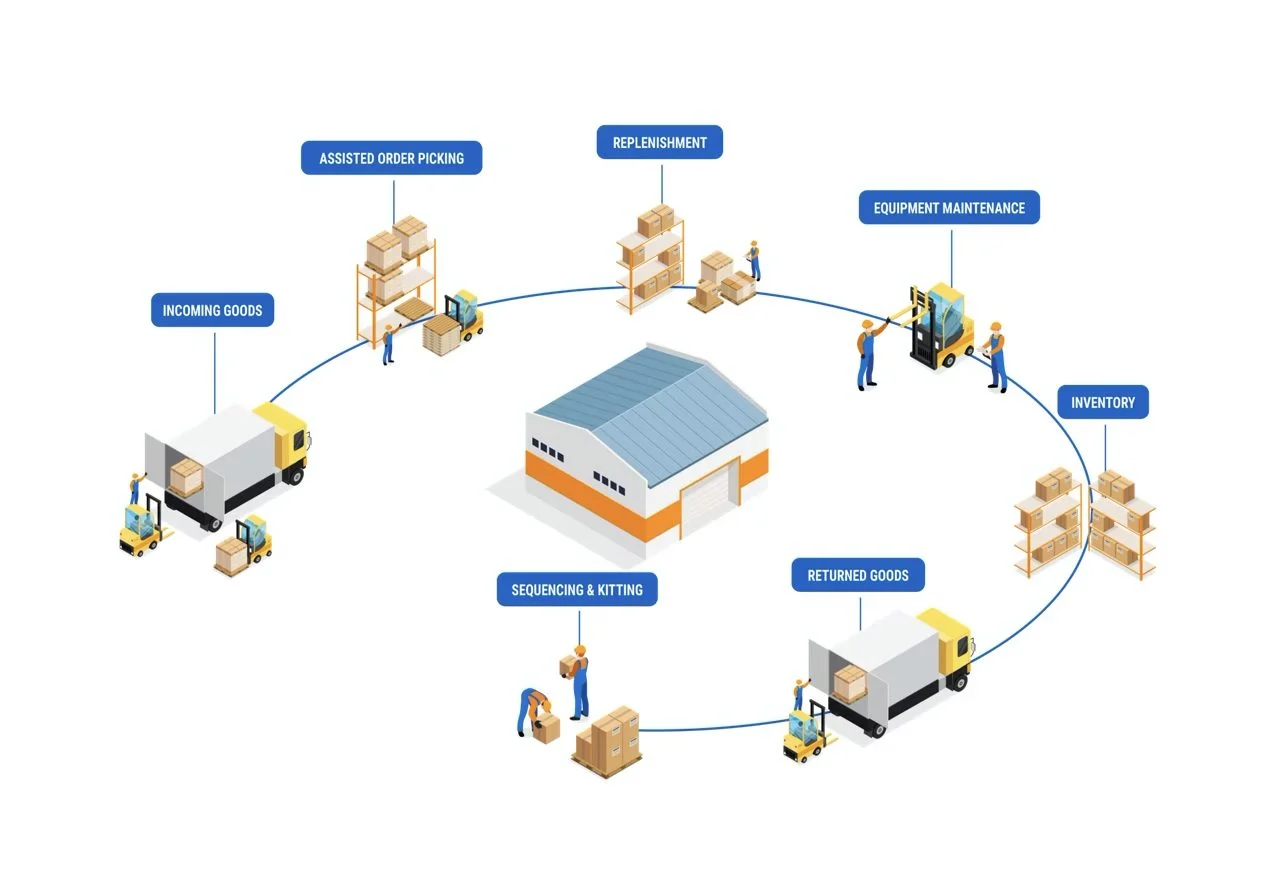
Every supply chain generates a flood of data — purchase orders, shipment records, warehouse inventory counts, vendor performance logs, freight costs, and demand forecasts. The problem isn't a lack of data. It's that this data usually lives in five different systems that don't talk to each other: an ERP, a WMS, a handful of spreadsheets, a vendor portal, and someone's inbox.
A data warehouse (DW) is what turns that scattered data into a single source of truth. Power BI is what turns that source of truth into decisions people can actually act on. Together, they're one of the highest-ROI investments a supply chain team can make — and one of the most misunderstood.
This guide breaks down what a supply chain data warehouse actually looks like, the KPIs worth tracking, and how to design Power BI dashboards that operations teams will actually open every morning.
Why Supply Chains Specifically Need a Data Warehouse
Supply chain data has unique characteristics that cause spreadsheets and single-system reporting to fall apart quickly:
Multiple Sources of Truth
Inventory counts live in the WMS, purchase data in the ERP, shipment tracking with a 3PL or carrier API, and supplier scorecards in yet another tool.
Time Sensitivity
A stockout alert that's 24 hours late is close to useless. Decisions need near-real-time or daily-refreshed data, not a monthly export.
Volume & Granularity
SKU-level, location-level, day-level data adds up fast — a mid-size distributor can easily generate millions of transaction rows a year.
Cross-Functional Alignment
Procurement, warehouse ops, finance, and leadership all need the same numbers sliced differently. A DW ensures everyone relies on one clean, historized copy.
What a Supply Chain Data Warehouse Architecture Looks Like
A pragmatic architecture for mid-size to enterprise supply chain operations:

Source Systems
ERP (SAP, Oracle, Dynamics, NetSuite), WMS, carrier/3PL APIs, supplier portals, vendor flat files.
Ingestion / ETL Layer
Scheduled pipelines (Azure Data Factory, Fabric Data Pipelines) pulling and landing data on schedule.
Staging Layer
Raw or lightly cleaned data. Catches schema drift and bad data before polluting downstream tables.
Data Warehouse (Star Schema)
Fact tables (shipments, inventory snapshots, PO lines) & dimension tables (SKU, location, vendor, date).
Semantic Layer / Power BI
Curated model with clean DAX measures, consistent naming, and pre-resolved relationships.
Reports & Dashboards
Role-based views: Executive summary, ops day-to-day, procurement view, and finance/cost view.
The KPIs Worth Building Dashboards Around
- 📈 Inventory turnover & days on hand — Are you carrying too much or too little?
- 🚨 Stockout rate & fill rate — How often are you unable to fulfill demand?
- 🎯 On-Time In-Full (OTIF) delivery rate — The #1 watched metric by operations leaders.
- ⏱️ Supplier lead time variability — Tracking consistency, not just averages.
- 🚚 Freight cost per unit shipped — Trended by lane, carrier, and shipping mode.
- 🔮 Forecast accuracy (MAPE) — Variance tracking by SKU or category.
- 💰 Working capital tied up in inventory — The finance-facing view of ops data.

Designing Dashboards People Actually Use
- Design by role: Executive summary vs. warehouse exception list.
- Exceptions over averages: Highlight the 12 SKUs likely to stock out this week.
- Honest refresh cadence: Label data timestamp clearly.
- Bookmarks & drillthrough: Keep report library lean & structured.
- Push alerts: Automate Teams/email alerts when KPIs cross thresholds.
⚠️ Common Pitfalls to Avoid:
Building reports directly on source systems, messy unmodeled DAX, unmonitored pipelines, and static dashboards never revisited.
Turn Your Supply Chain Data into Your Greatest Competitive Advantage
We build supply chain data warehouses and Power BI reporting layers end-to-end — from ETL pipeline design and dimensional modeling to dashboards operations teams open every morning. That includes automated pipeline monitoring and alerting so failed loads get caught before impacting your Monday morning reports.
Get in Touch with XProwessOur BI Service Suite
Data Warehousing
Design and build scalable data warehouses on Snowflake, Azure Synapse, or AWS Redshift for centralized, high-performance data storage.
Dashboard Digitization
Interactive Power BI and Tableau dashboards that transform complex data into visual stories, enabling faster and smarter decisions.
ETL & Data Pipelines
Automated Extract, Transform, Load pipelines using SSIS, Azure Data Factory, or Apache Airflow for seamless data integration.
Real-time Analytics
Stream processing with Apache Kafka and real-time dashboarding for live business monitoring and instant anomaly detection.
Reporting Automation
Scheduled reports with SSRS, paginated reports, and automated email distribution, eliminating manual reporting burdens.
Data Governance
Implementing data quality frameworks, master data management, and compliance standards (GDPR, HIPAA) across your data ecosystem.
Our BI Process
Discovery
Deep-dive into your data landscape, business KPIs, and reporting needs.
Architecture
Design the data warehouse schema, ETL flows, and security layers.
Development
Build pipelines, dashboards, and reports in iterative sprints.
Deployment
Go live with training, documentation, and ongoing support.
Ready to Unlock Your Data Potential?
Let our BI experts show you how to transform your data into your biggest competitive advantage.